Daniel De Montmollin is a Swiss potter (and a monk, « Frère Daniel »), born in 1921. He is well-known in Europe (and particularly in France), for his work on high-fire glazes and ash glazes. At most of the ceramics schools in France, glazes are taught according to his books Pratique des Emaux de grès, 1987, and Pratique des Emaux de Cendres, 1997. Both books are now edited as a single volume by La Revue de la Céramique et du Verre, a French editor, and frequently out-of-print. There is an English version that may be easier to get at times than the French version, depending on stocks.
The following is a summary of the main part of the first book, where he explains the principles and use of so-called melting diagrams. Follows 60 diagrams, with only sparse commentary on some diagram sets, more fitted to achieve certain glazes (celadons, oilspots …). Generally the book is clear, with an easy-to-read and down-to-earth approach.
I tried to merely paraphrase the book, without distorting too much the text. Graphics are taken from my version of the book, which happens to be French. I translated “fusion” to melting, which seems more appropriate. Italics show my own text, rather than a translation.
Introduction to fusion (melting) diagrams
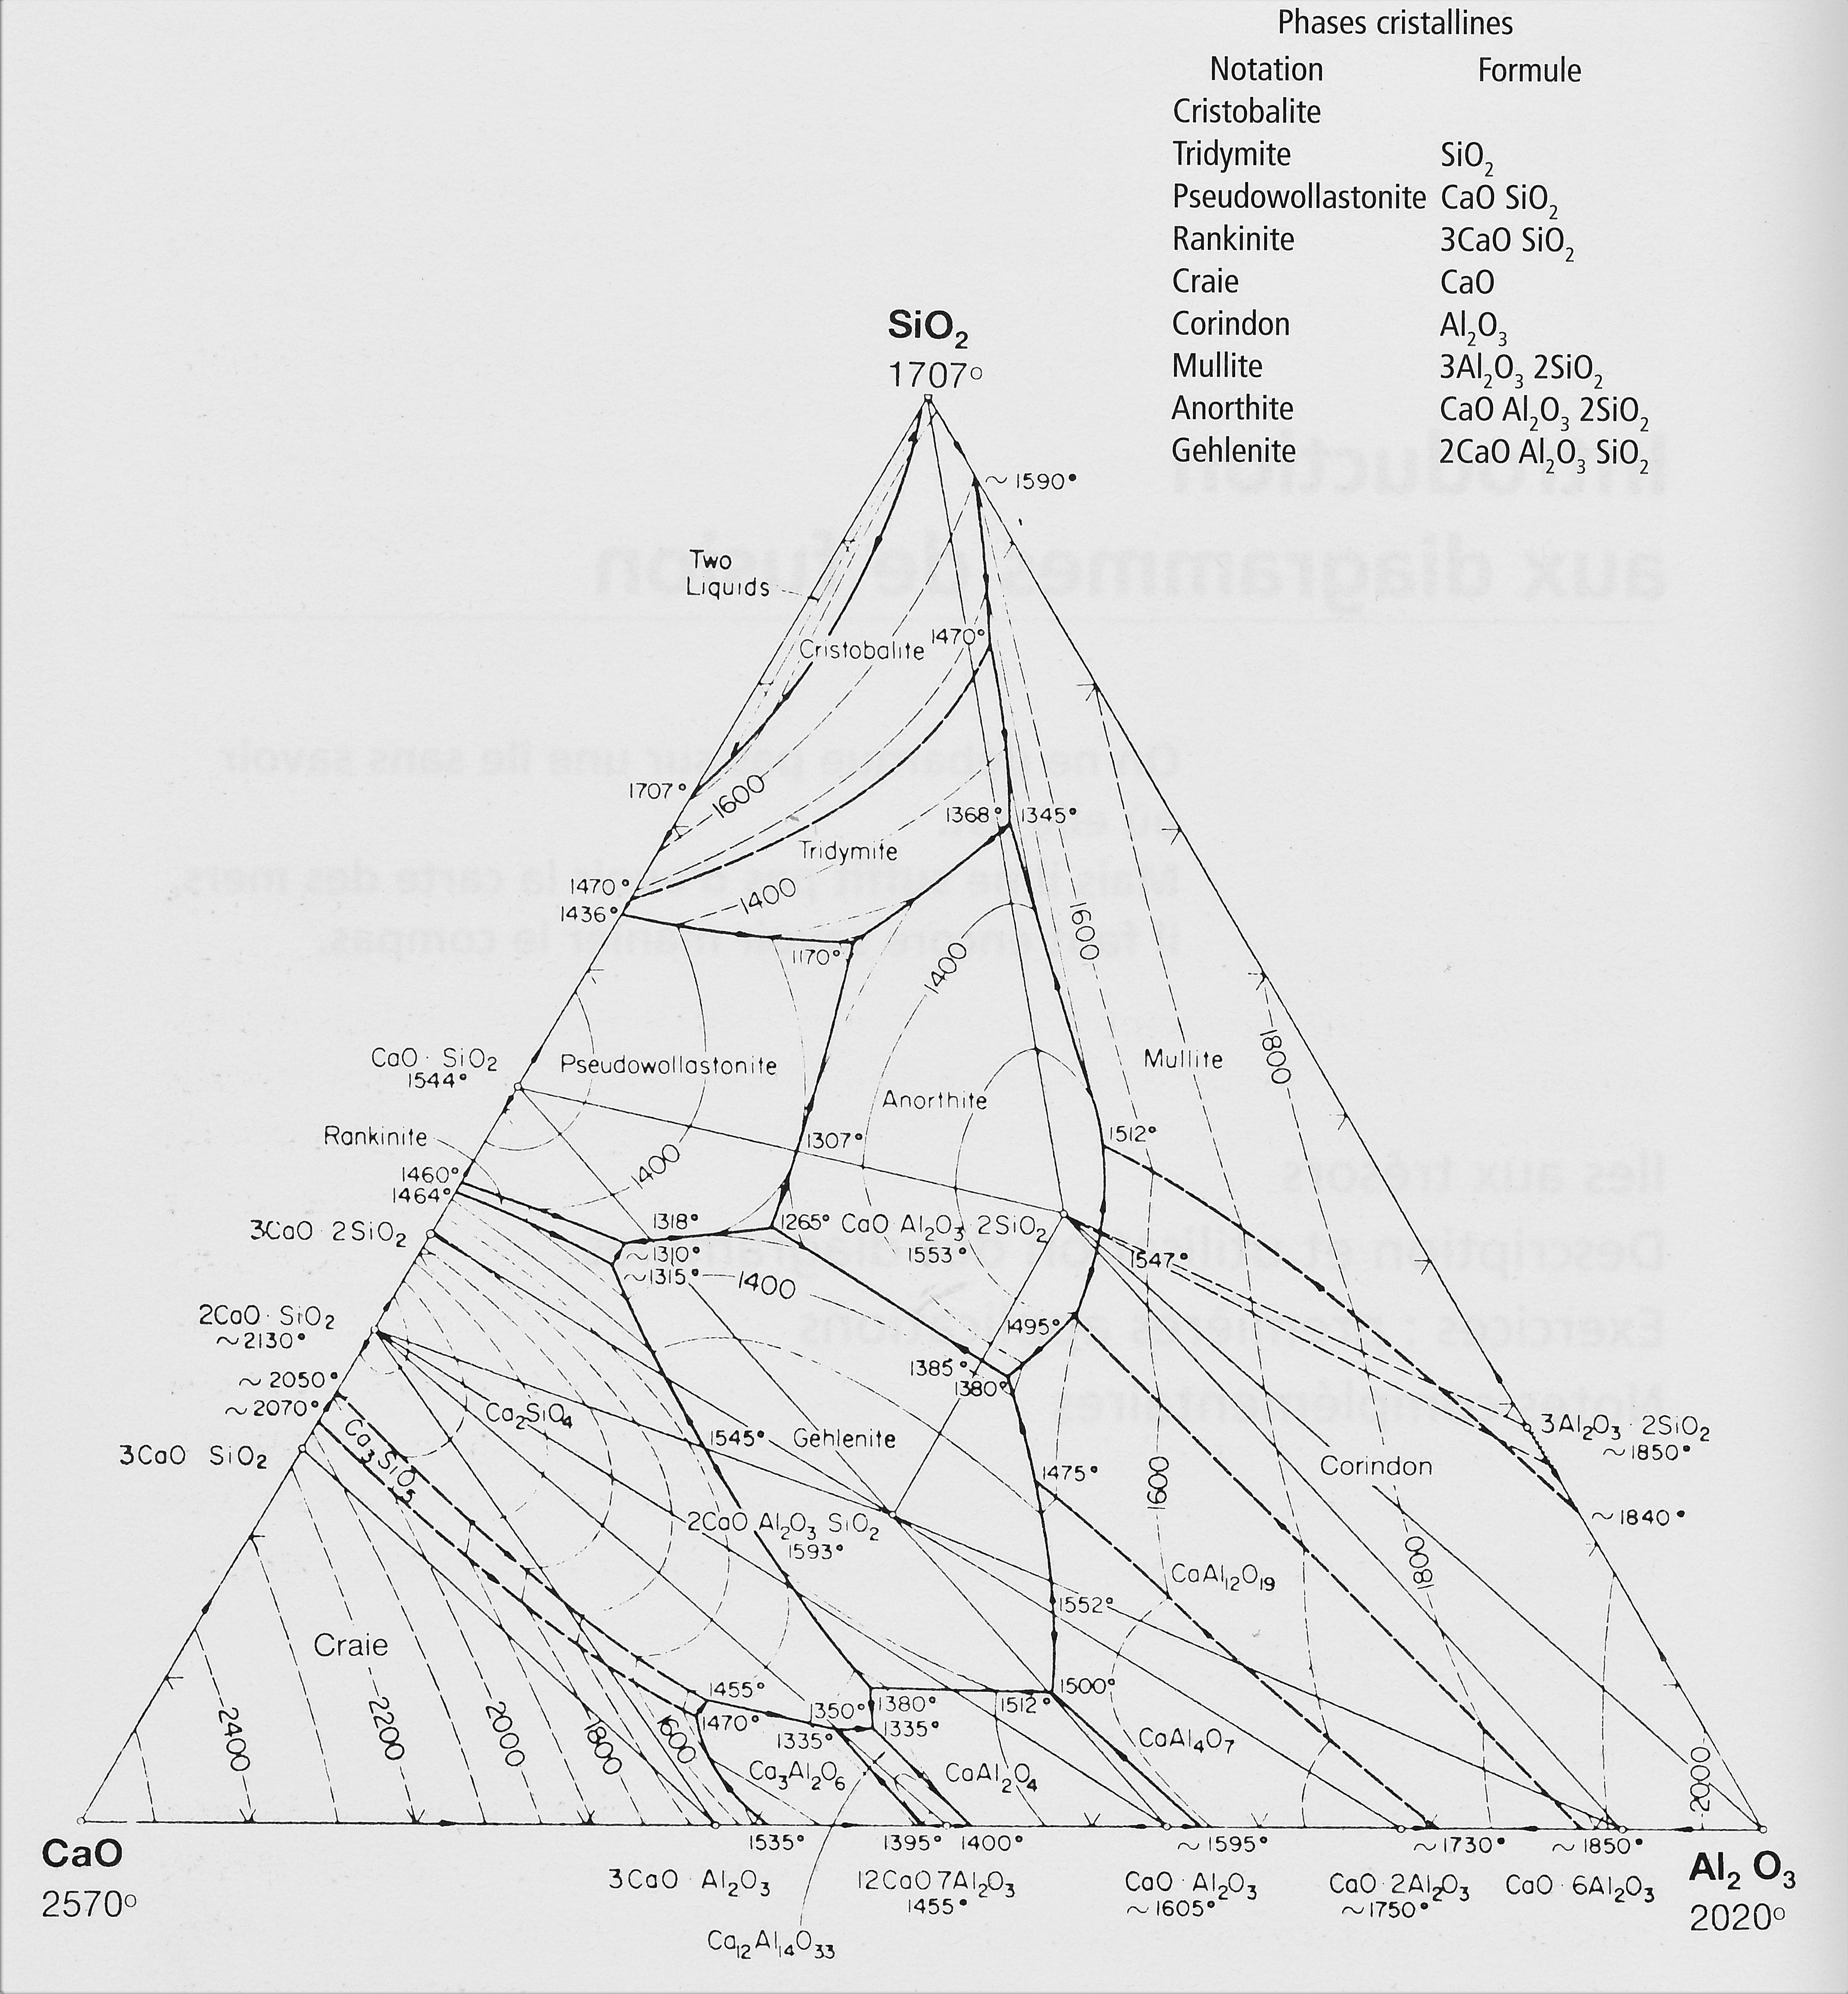
Melting diagrams are a particular “screening” for the potter of more general (and complex) phase diagrams, which are an attempt to describe what happens to a mix of oxides during firing. These diagrams are not easy to find and hard to understand for the layman (aka potter). As an example is reproduced the phase diagram of a CaO-Al2O3-SiO2 system, extracted from the Phase Equilibrium Diagrams of Oxide Systems, vol. 1, published by the American Ceramics Society. This same book has been used as the base for establishing the melting diagrams.
If a sailor wants to go to a specific island without having a sea map, he will not succeed. Thus the melting diagrams give the coordinates of 60 “treasure” islands where the potter can land if he chooses to. One diagram will “locate” the melting zone of a glaze, however it will tell nothing about how the glaze will look like because many other parameters are involved.
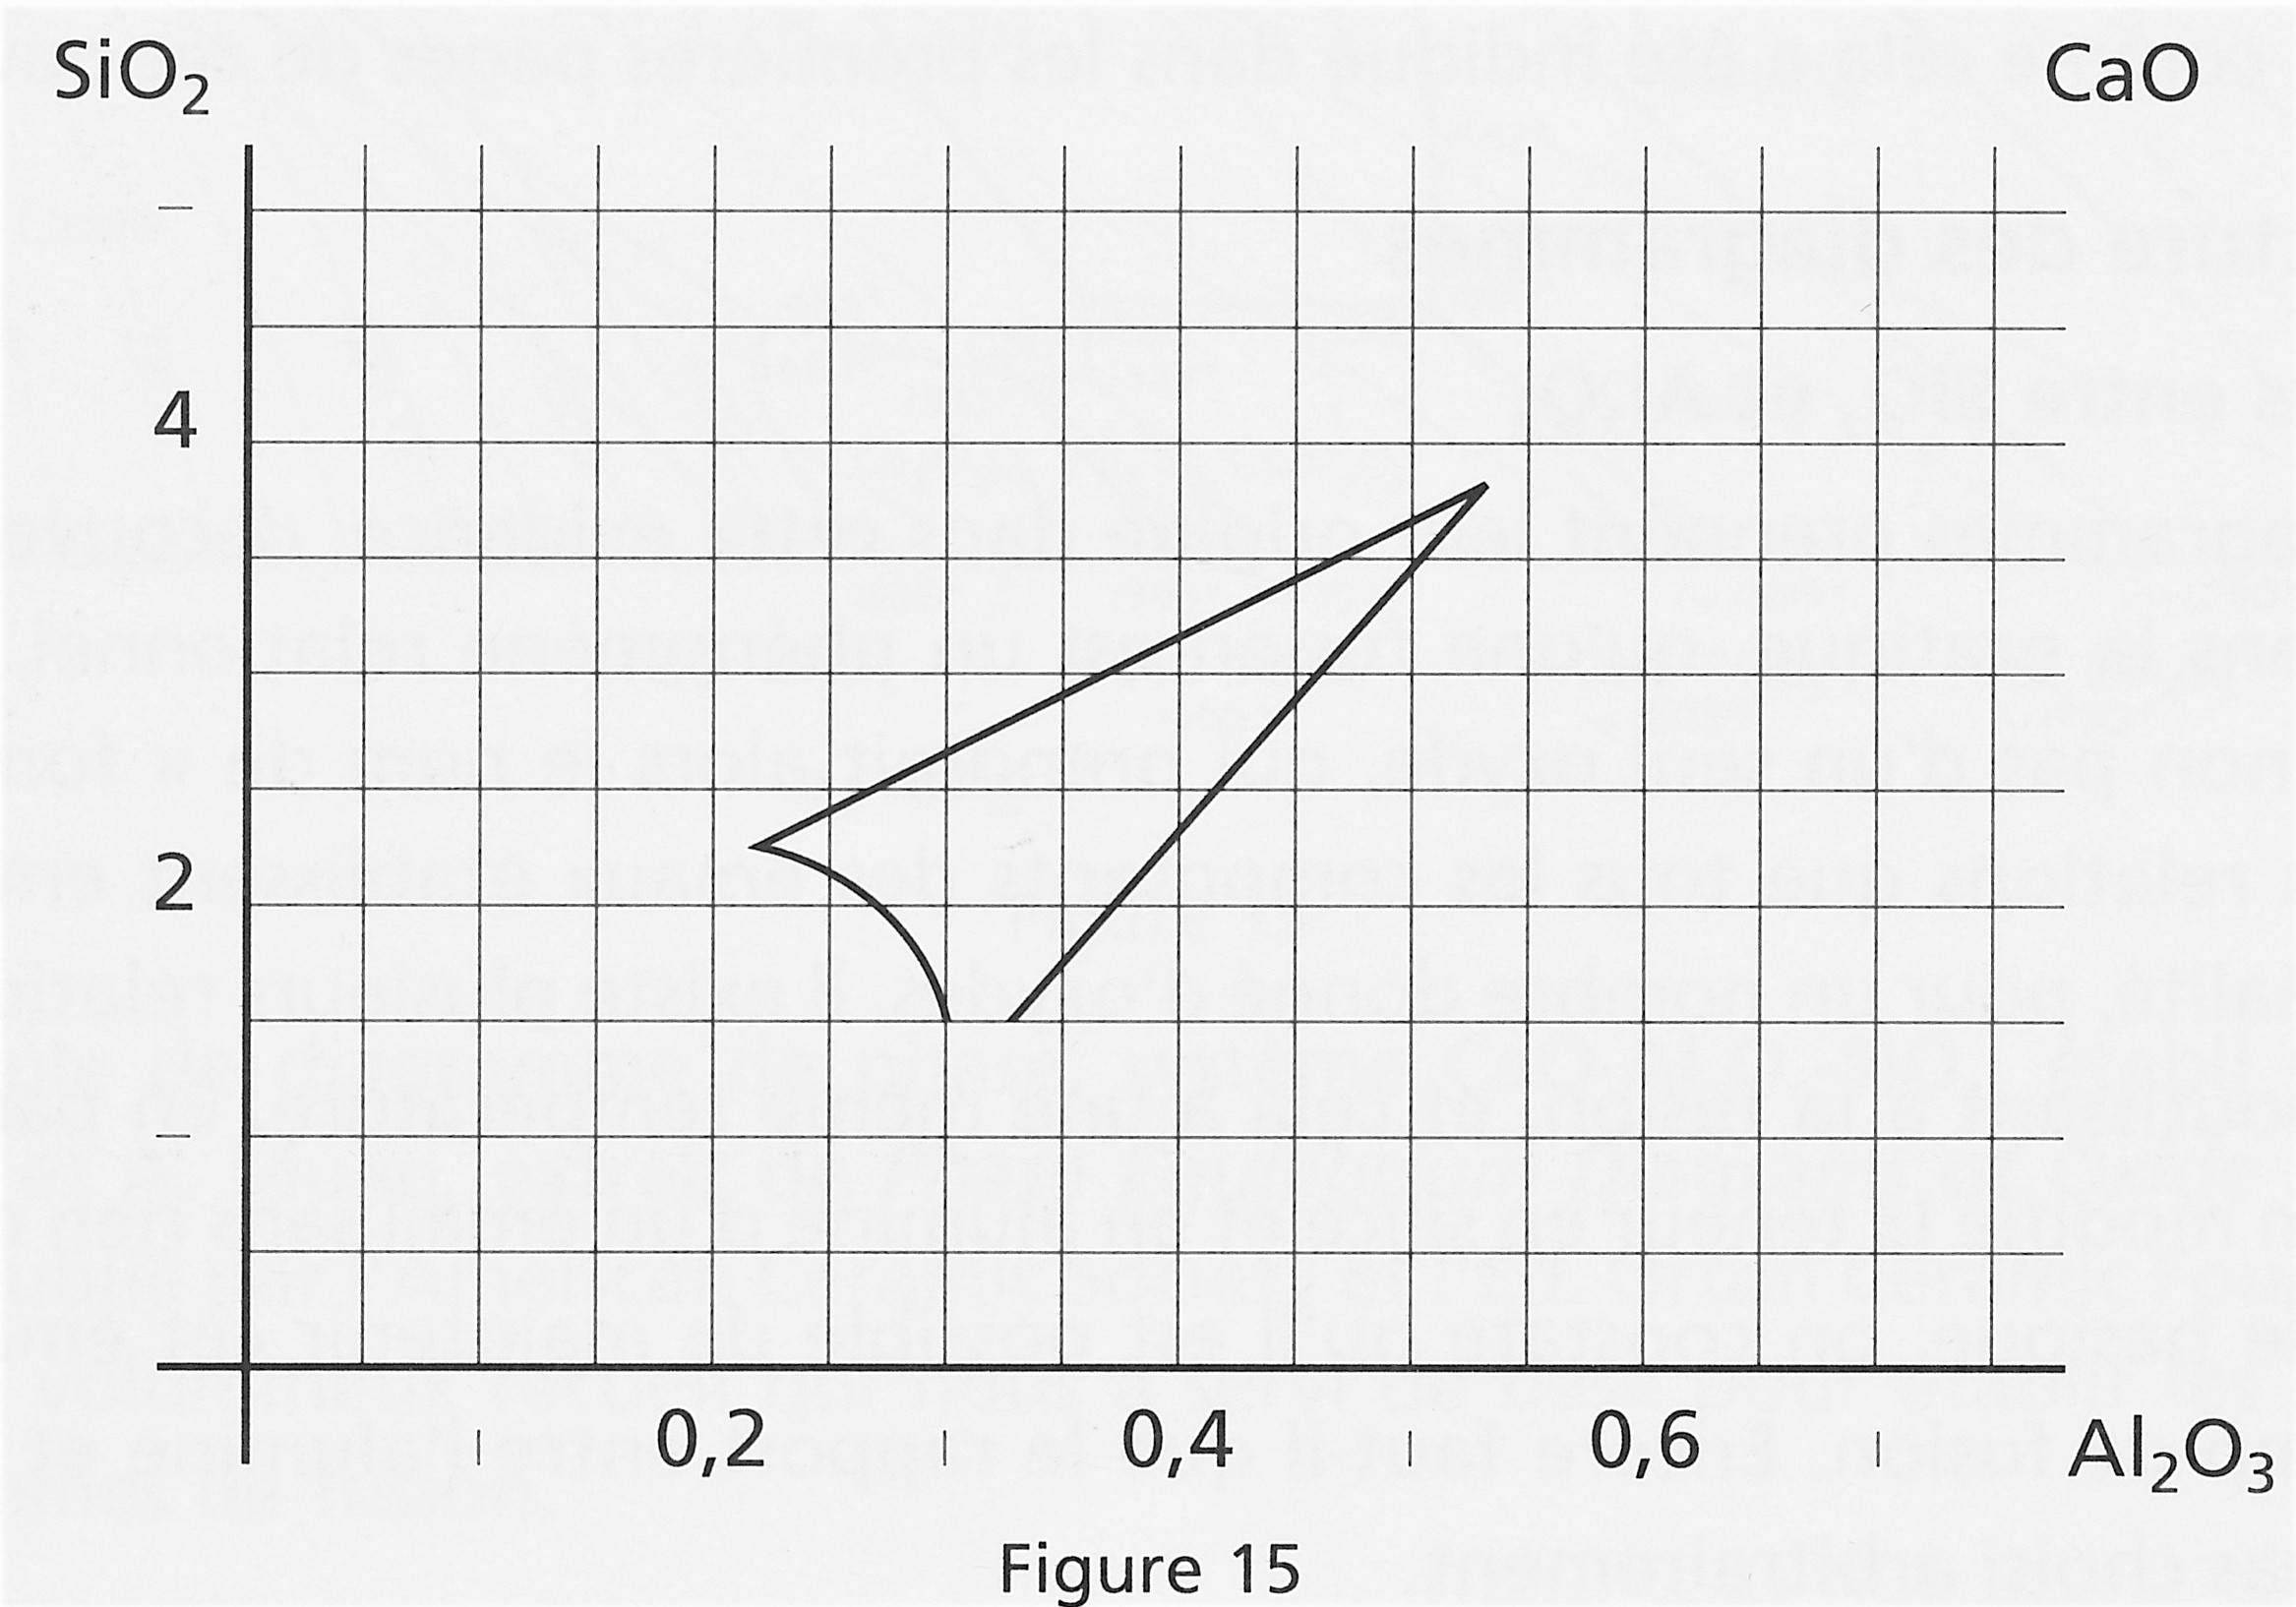
Melting diagrams show that melting is a relational event, which depends on the relationships between the glazes components, rather than on a single one (which would be called a “flux” - see more on this below). For a given set of oxides, there are several possible relationships that may lead to melting, at a given temperature. In particular, when changing the silica and alumina amounts in a glaze, while keeping the base mole unchanged, it is possible to maintain this glaze inside its melting zone. This zone is precisely what the diagrams are showing: for a specific base mole (Seger’s formula first column), all the SiO2 and Al2O3 ratios that may lead to the melting of the glaze. SiO2 is measured in 0.5 moles on the Y axis, while Al2O3 is given in 0.05 moles on the X axis (see Fig.15 below).
Temperature contour
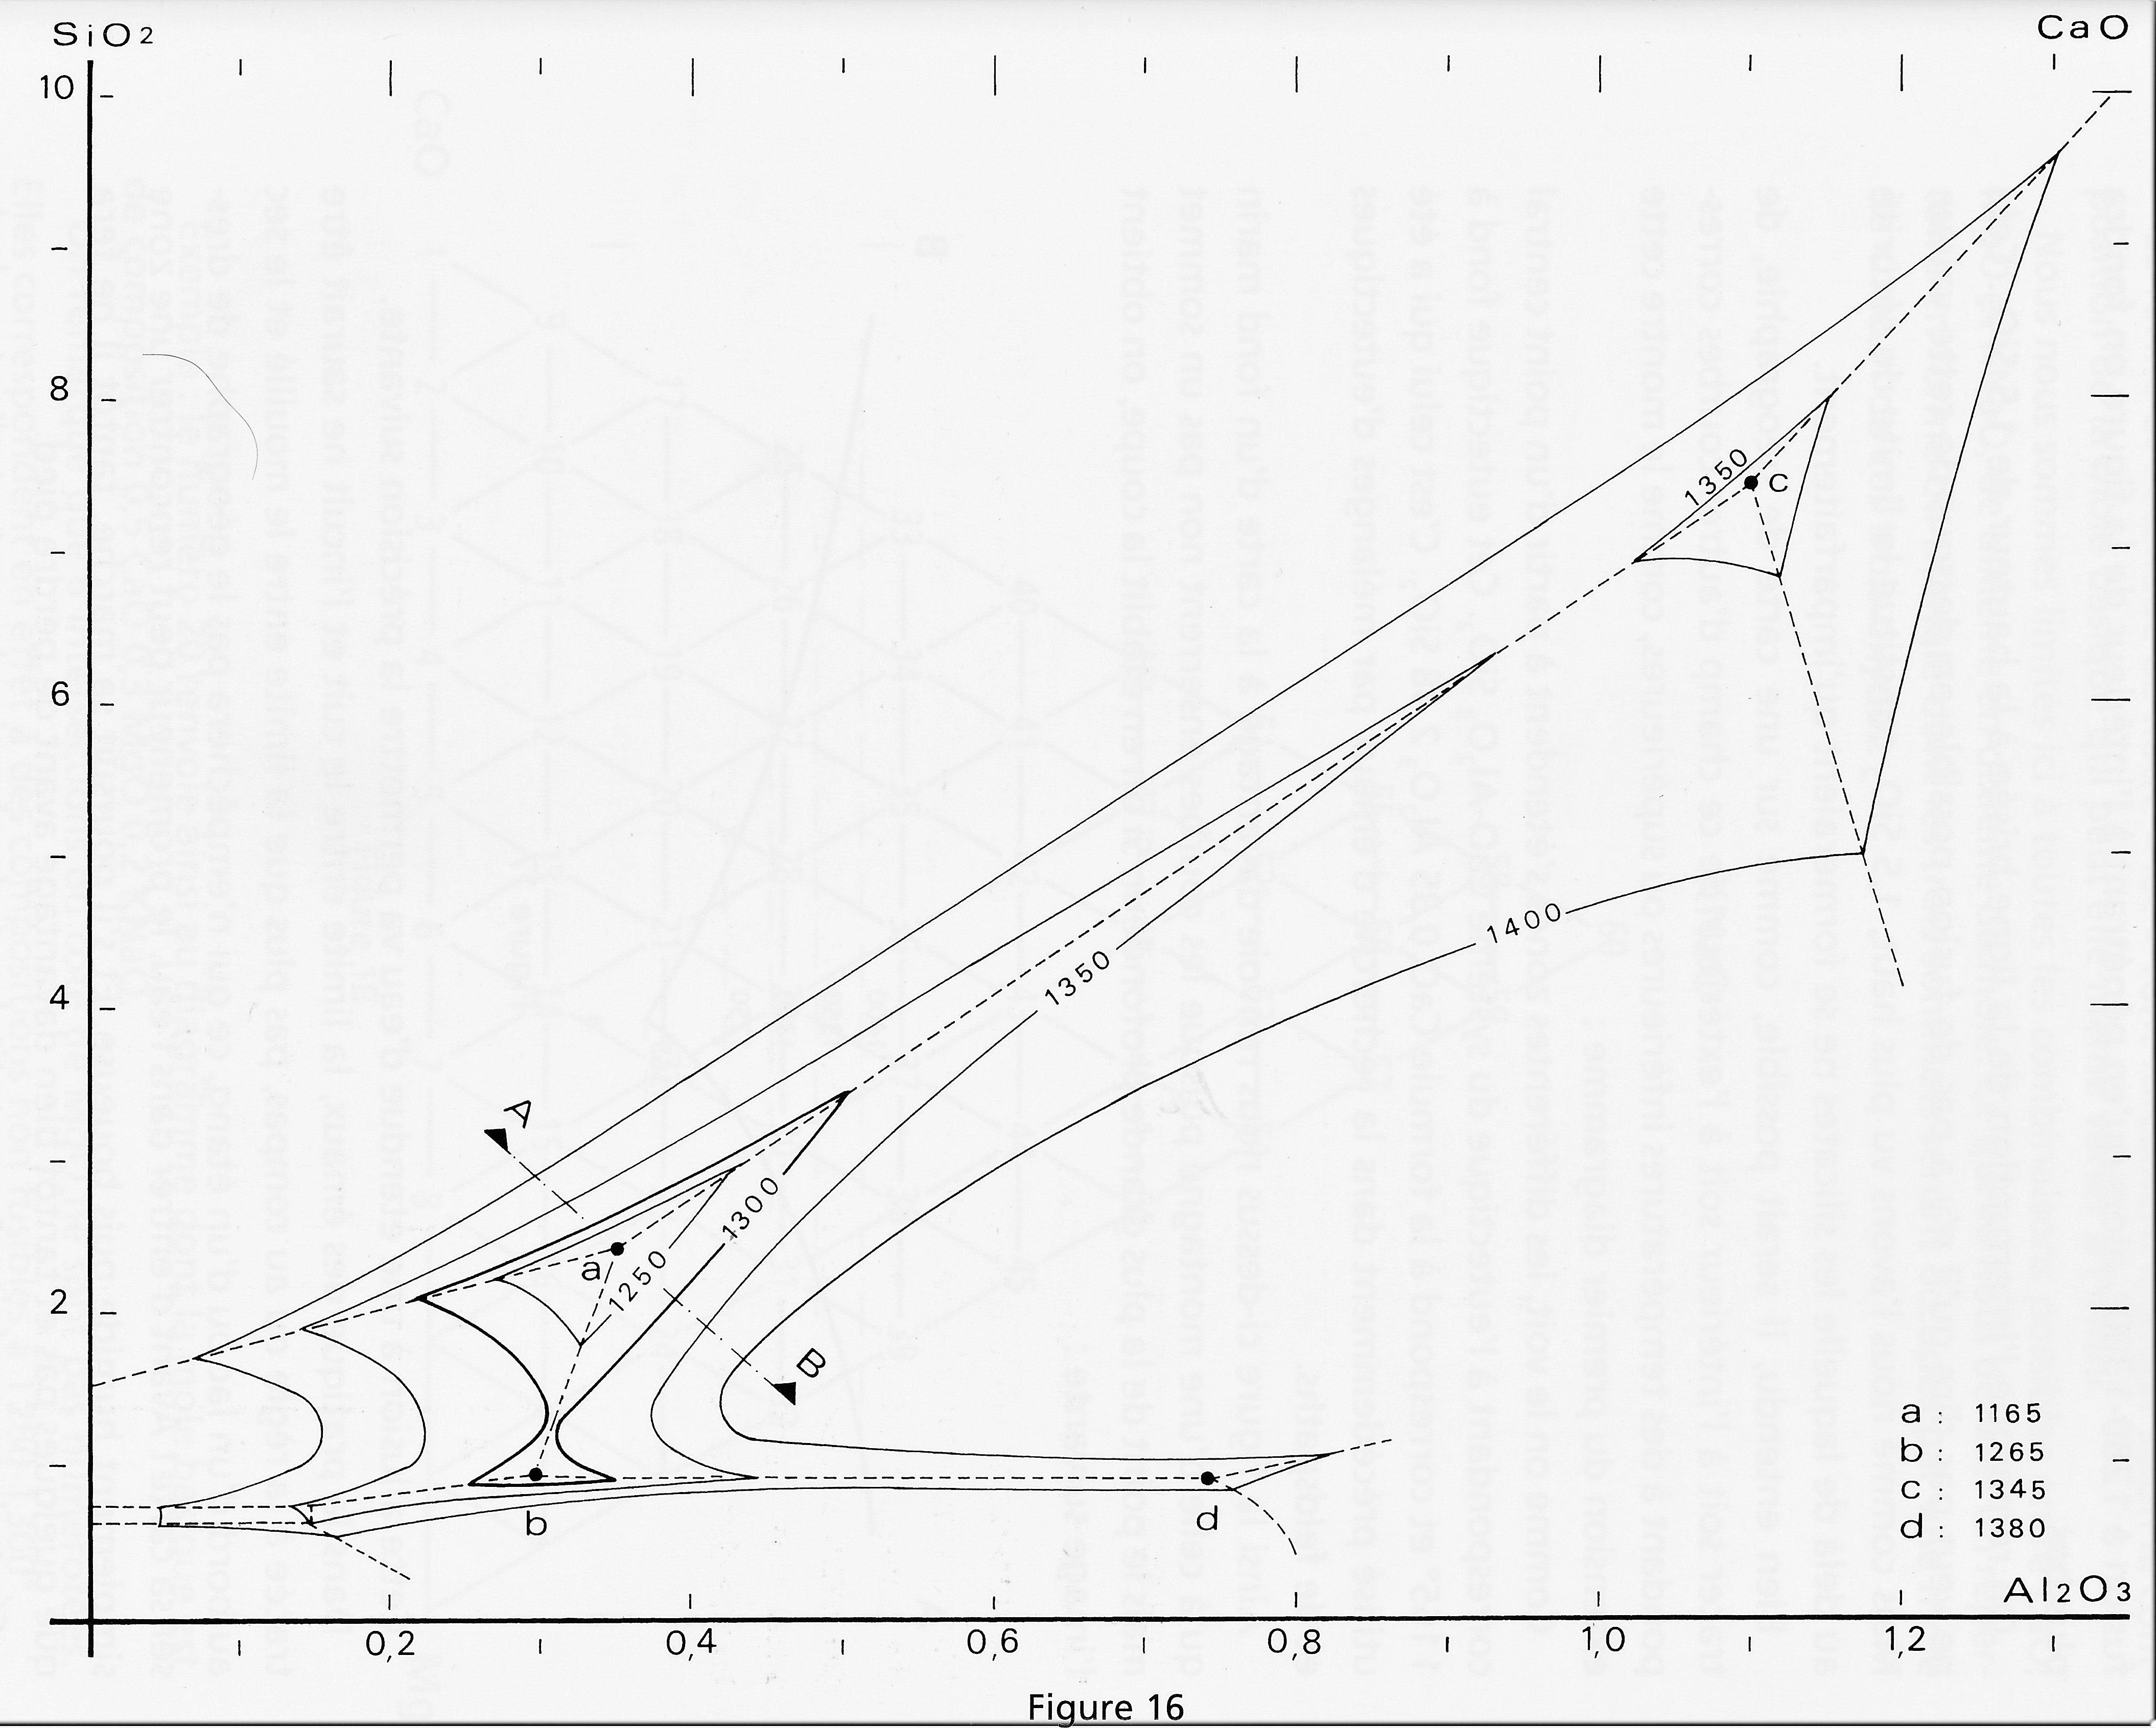
Let’s imagine an alpinist who would like to go around a mountain, staying at an altitude of 1300 m. To do so, he will follow the 1300 m contour on his map, ignoring the other contours. Likely, the diagrams show only the 1300°C temperature contour, typical of glazes high-firing. The diagram below shows the melting behavior of a CaO-Al2O3-SiO2 system. By following the contour, we get the melting at 1300°C, while by getting inside the curve the melting will occur at lower temperatures. Note that the contour is interrupted at 1.5 SiO2. Under this value, melting can still occur, but silicates will not form properly.
Obviously, other contours could be drawn (like on a geographical map), as an example a more complete map of this system is given, with at the core the minimum temperature of 1165°C (eutectic of this system).
In fact the graph above looks more like one of a seabed than of a mountain. A side view would look like this:
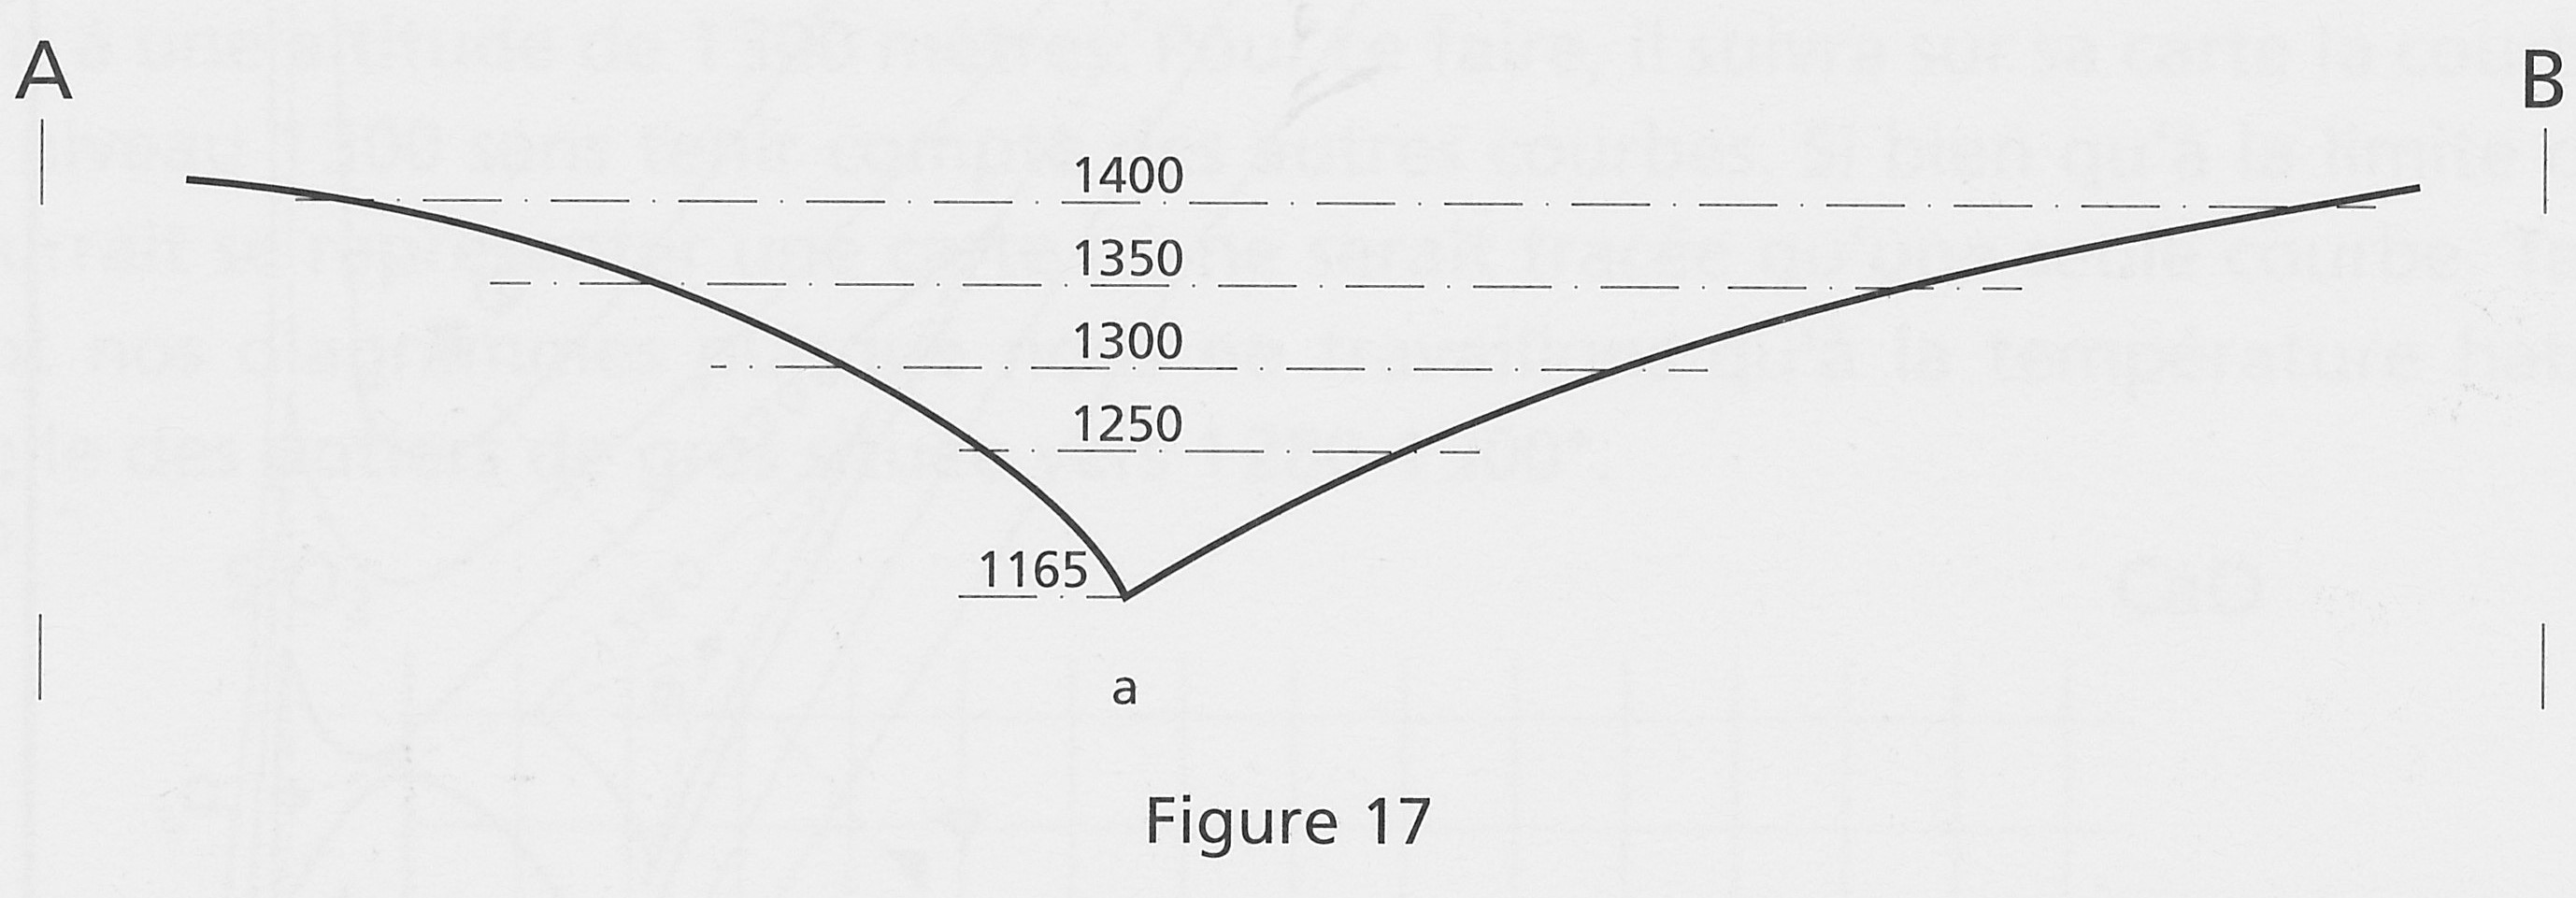
This “seabed” metaphor emphasizes the fact that there is no clear-cut border between fired and unfired, as, on the bank of a lake, there is no clear border between wet and dry (notwithstanding the map accuracy). So it is by wandering from one side of the line to the other side that the potter will find the best melting properties of a specific glaze.
The diagrams index
The shape and width of the “lake” will obviously change with the base mole components.
The diagrams in the book are limited to all possible combinations of CaO, MgO and KNaO (i.e. K2O+Na2O), in tenths of moles, to compose the base mole. Which gives the following triangle map:

Ex: Diagram 20 is the one with 0.5 CaO, 0.3 MgO 0.2 KNaO.
The unnumbered points near MgO are combinations that are not melting at 1300°C.
How to use the diagrams
There are 4 exercises presented to demonstrate the use of the diagrams. Here are the two first ones.
The cutting
As the border between melted and not-melted is not a sheer line, the potter can do some “cuts” at several, well-separated regions of the diagrams to explore melting (here on diagram 27):
The sweeping
One can also explore more thoroughly the whole melting area of the diagram (here on diagram 18):
The “flux” concept
The term “flux” is often used by potters. But according to the diagrams, it is not really a proper term. For instance, let’s consider diagram 27, and mark points A and B, far from the melting zone of the glaze. For the glaze to melt, we have to come nearer the contour one way or another. For point A, we could decrease silica, which seems logical, since silica has a high melting point. But we could as well increase Al2O3, and by much, even if alumina is even more refractory than silica. For point B, it’s the reverse. Decreasing alumina (which seems logical), but also increasing silica, which is not!
It shows that it is not an oxide alone that melts a glaze, but the relationship between oxides.
Other topics in the introduction
The rest of the introduction chapter provides succinct information about the influence of the firing length on melting, melting and atmosphere, melting and crawling, glaze melting adjustment, glazes overlay, etc …
Diagrams
60 diagrams are reproduced, as per the triangular map.
Some diagrams have a vertical line, depending on the value of Al2O3 : this is the separation between glazes that can be made using feldspars, and glazes that can only be made using frits (because the alumina content is too low for a feldspar).
As an example, here is diagram 25. This is the De Montmollin representation of the Stull map. For more information on the Stull map, go here.

This screen capture shows how I used diagram 18 for one of my glazes:
Rest of the book
The part on diagrams starts on page 71 (French print). The first part of the book provides more information about glaze chemistry, how to mix glazes for testing, how to make tiles, and some experiments with common oxides. There is much valuable information about the role of iron oxide in glazes, and most of the experiments involve iron oxide.
This text as PDF
Daniel De Montmollin.pdf (1.3 MB)


